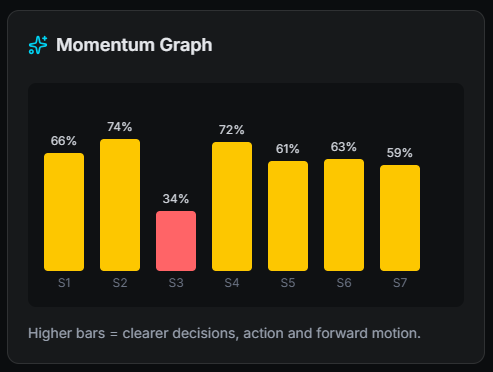
Momentum Graph
The Momentum Graph represents how forward-moving a conversation is over time. It highlights moments of progress, alignment, and friction during a meeting.
Momentum is derived from conversation patterns — not from audio, video, or sentiment.
What Momentum Reflects
Momentum captures signals in how the discussion evolves, such as:
- Whether the conversation moves toward clear outcomes
- If participants stay aligned or diverge
- How often progress stalls or resets
Momentum Scale
Momentum values range from 0 to 100 and represent how consistently the conversation moves forward.
- 80–100: Highly aligned and forward-moving
- 60–79: Mostly productive with minor drift
- 40–59: Frequent interruptions or unclear direction
- 0–39: Confusion, derailment, or stalled discussion
How to Interpret Momentum
Drops in momentum usually indicate:
- Sudden topic shifts
- Misalignment between participants
- Unresolved questions or confusion
- Discussion without clear direction
Sustained peaks suggest clarity, alignment, and forward progress.
Practical Examples
- Planning meetings: Momentum often starts low and rises as the team aligns on direction.
- Status updates: Flat momentum may indicate information sharing without progress.
- Problem-solving sessions: Sharp drops usually reflect confusion or unresolved blockers.
Limitations
Momentum is an analytical signal, not a judgment of meeting quality.
- No sentiment or tone analysis is used
- No audio or speaker emphasis is considered
- Only conversational structure affects the score